
Where did Economic Reforms Succeed?
Where did Economic Reforms Succeed?
They doubled the alpha growth rate of GDP and reduced poverty by two-thirds.

Growth and productivity
after ER-91:
If the proof of the pudding is in the eating of it, then success of the reforms should be measured by following three parameters:
Acceleration in growth
The difference in growth rate over 30 years, preceding the economic reforms, and after them, should be a pretty reliable indicator of the efficacy of the ER-91 package. And indeed, we find, the trend growth after Economic reforms doubled to 7% pa from 3.5% pa before reforms.
The charts are reproduced below:
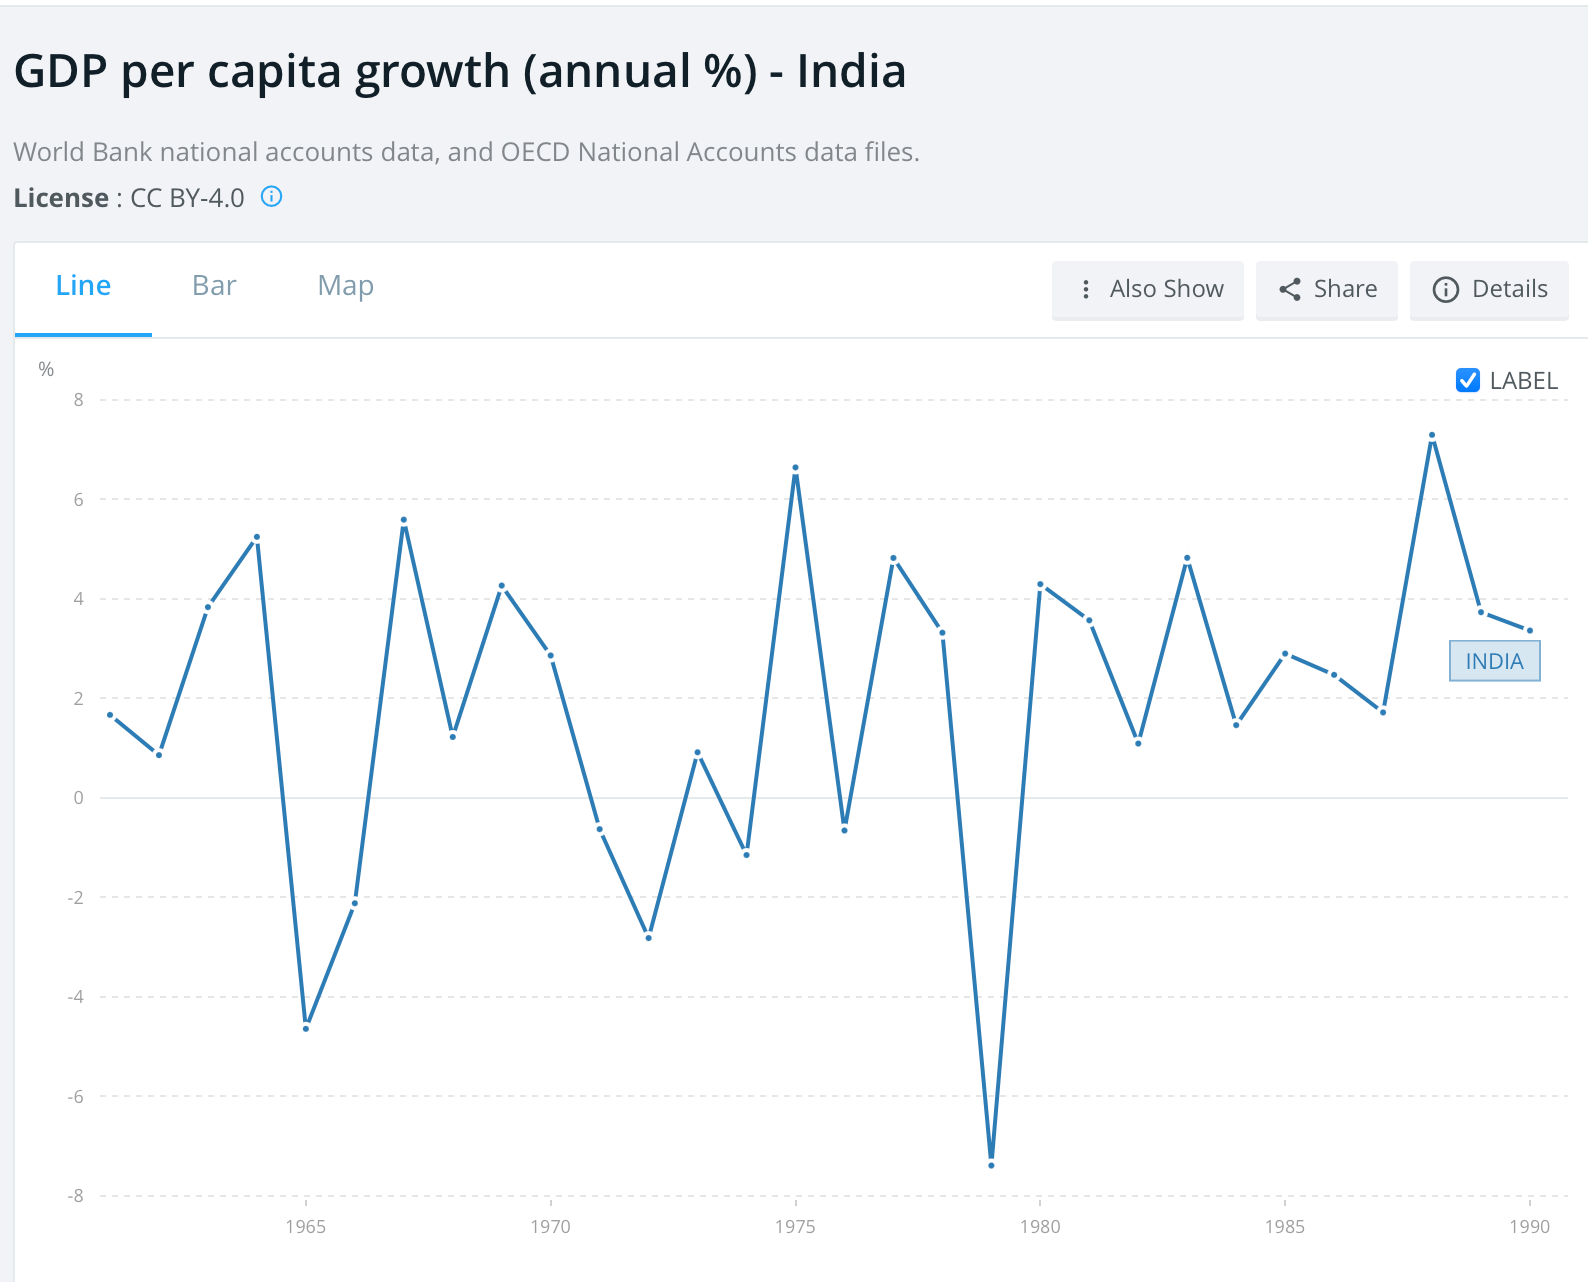
Before reforms, over 30 years, from 1960 to 1990, we averaged a growth of 3.5% pa in per capital Income.

After ER-91, the average growth in per Capita Income, over a 30 year period, from 1990 to 2020 averaged between 6 and 7% pa. For all practical purposes, we can growth increased from 3.5% per annum before reforms, to 7% after reforms. That by itself is no mean achievement. However, a lot more was possible had the opportunities been grabbed.
Increase in productivity.
One of the major claims made for the economic reforms was that be eliminating licensing, allowing large corporate houses grow unhindered, and generally scaling back regulation of output, coupled unwinding of Govt. control over product prices, interest rates etc, the boost in productivity and efficiency would increase GDP growth rate.
Pertinent to note here that most of reforms in the ER-91 package were aimed at boosting the productivity of industry, particularly manufacturing. The package had little to boost agriculture, although it talked of cutting subsidies, and largely ignored the services sector.
Given this, one would expect maximum gains in productivity to come from manufacturing, followed by Agriculture. Services was largely left alone to fend for itself.
Measuring increase in productivity is a difficult business. Nevertheless the World Bank does compile data on many countries, and we can examine this data in terms of output per worker in Agriculture, industry [manufacturing plus construction], and services. We can also look at energy efficiency of the economy as a whole. The data reveals significant information, as also areas in which things went wrong.
A big lacuna here is that the data takes into account workers directly employed in a sector without taking into account the number of unemployed. India’s overall labour participation rate is 52%. Apart from growth in per capital income, that correctly counts the unemployed as well in the denominator, the other output per worker data is grossly overstated.
The per worker output does not explain all of the possible productivity gains in an economy but is nevertheless a good indicator of them. Here is the output per worker in Agriculture.

Note the abysmal level of output worker in India compared to the US. But we are concerned with trends here. The disaggregated data, given the following table explains the gains in output per worker for Agriculture, Industry, and services for India, China and US. US and China are our main trading partners as also competitors. So they are included in this analysis to give a sense how India is placed with respect to its trading partners.
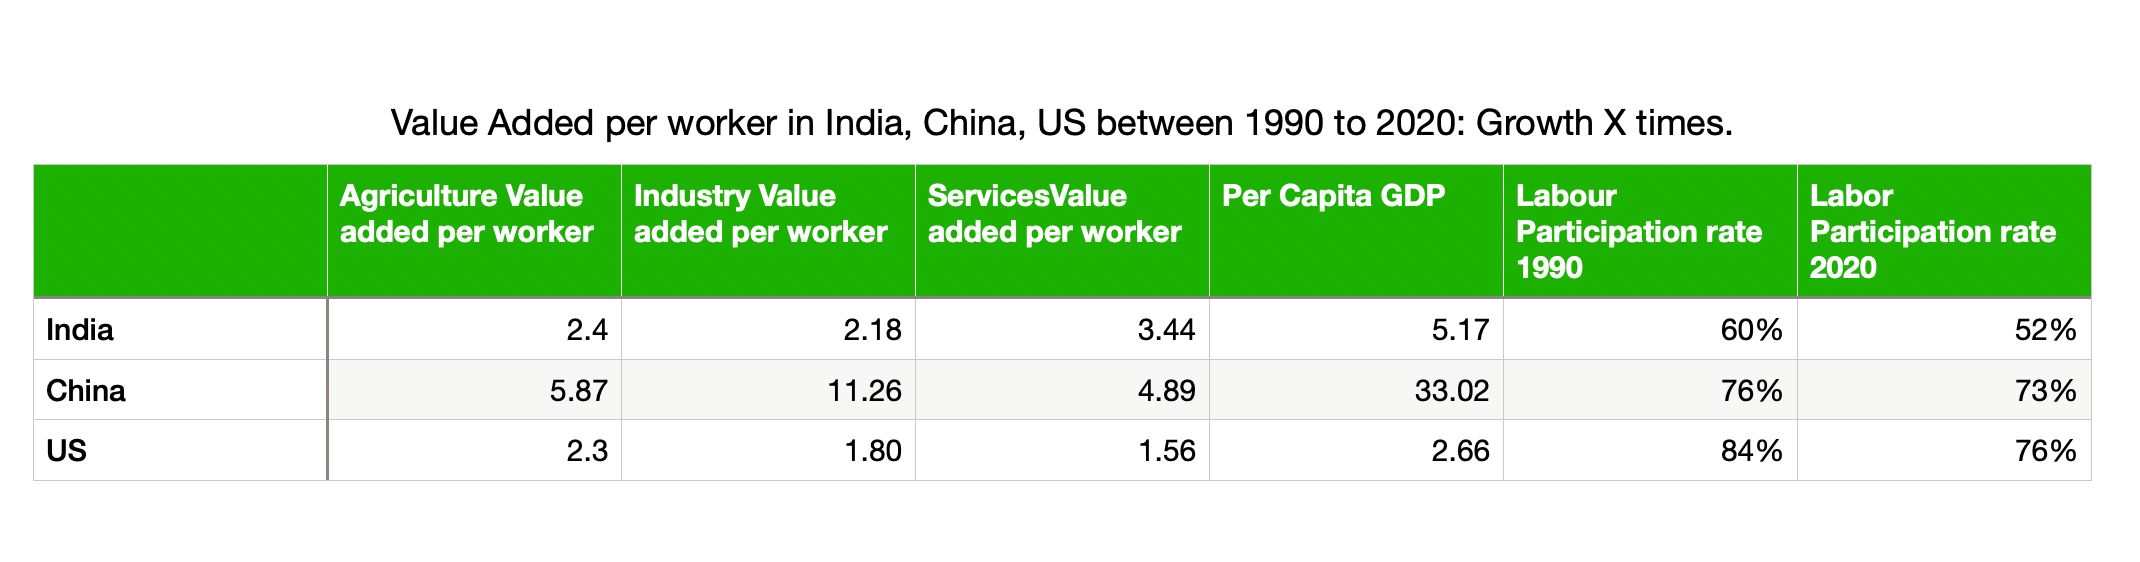
Over the 30 year period from 1990, Agricultural output per worker in India grew 2.4X times, compared 2.3X times in the US, and 5.87X in China. In absolute numbers, the US is way ahead of us with an output of $90,000 plus per worker compared to $2000 per worker In India, and $4191 in China. Since India China started from a similar base, Chineses output at 2.5 times India’s shows how we lagged in productivity vis-vis-our trading partners. Since there were virtually no productivity boosting reforms in Agriculture, the growth in output per worker is natural underlying trend in growth. The US output per worker grew at almost the same rate as India.
Growth in industrial productivity was rather modest, especially when compared to China and the US. In fact manufacturing registered steep decline as percentage of GDP over past 30 years. The sector’s woes were made worse by duty inversion caused by faulty exchange management. While the sector received the maximum rents and subsidies from Govt., or perhaps because of such rents, productivity and performance was abysmal.
What do the numbers show?
Over 30 years of economic reforms, output per worker in Industry in India grew 2.18X times. In comparison, output in the US per worker grew 1.8X times while in China it grew 11.26X times. Yep, let the numbers sink in for a bit.
First off, recall that almost all of the reforms, be it licensing, lifting of MRTP restrictions, labor reforms, banking reforms, whatever, were aimed at boosting Industry. And yet, the output per worker in Industry which attract the highest amount of funding and rents from Govt., increased its output per worker by 2.18X compared to 2.4X in agriculture, and 5.17X in services. What the hell ails our industry?
The output per worker in Industry grew 1.8X times in the US which is more or less in the same range as that of India at 2.18X, but the absolute level was $108,265 compared to India’s at $6754.
China’s output, starting from the same base as that of India in 1991, grew from $2244 to $25,272 per worker, or 11.26 times. Mind China started from a slightly lower base than in India in 1991.
Indian industry’s abysmal performance is inexplicable. A stunning failure of the reforms package despite the hype.
Yet as you can see, Modi is still cuddling this creaky inefficient sector as our darling to be showered goodies like tax cuts, high tariff walls, high customs duties, right to hire and fire workers, and even a developmental bank of its own for phone banking. Why are we so perverse when facts stare us in the face?
I am not going into what ails manufacturing at this stage. I shall but later in this series of essays.

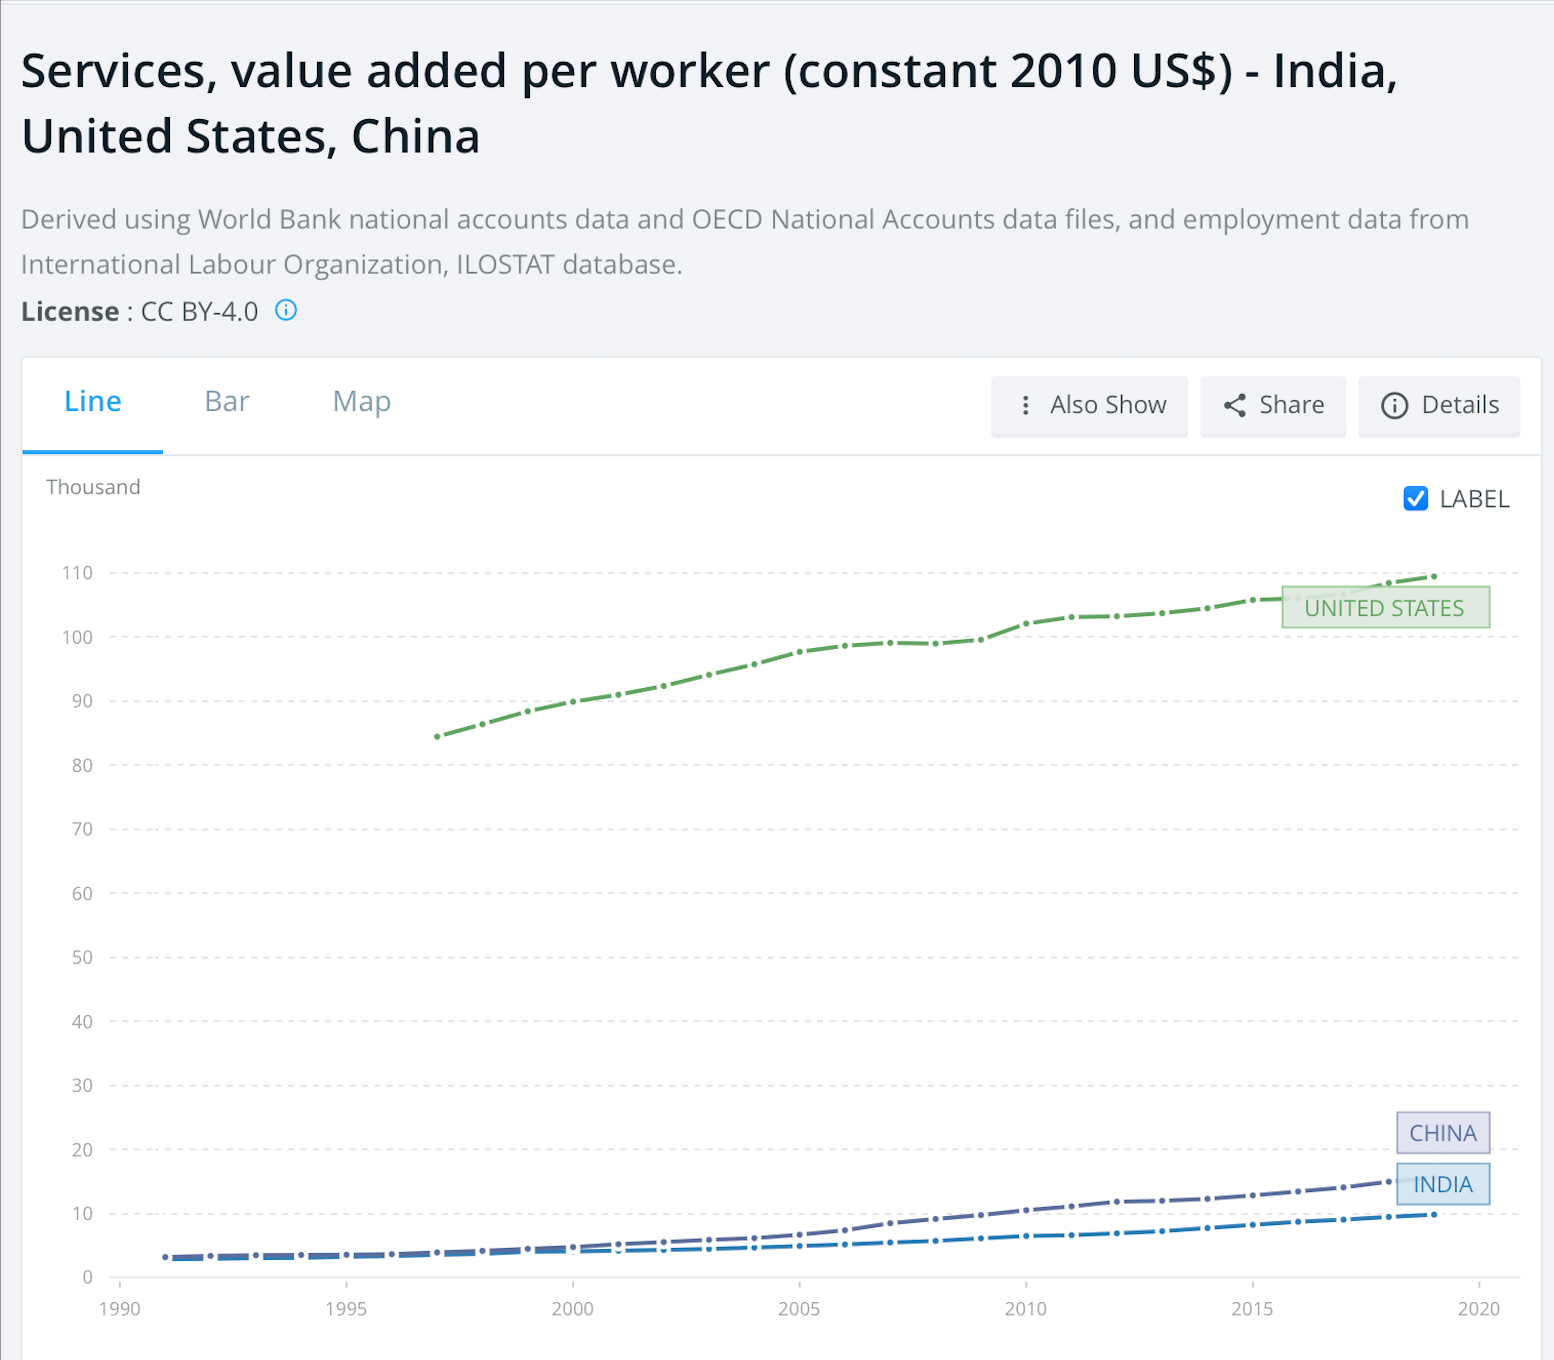
Services industry, which includes software services, retailing, real estate except construction, etc did very well compared to Agriculture and Industry.. It grew across the board as percentage of GDP, higher than average growth in sector itself, but more importantly in output per workers. Most of the growth in per capita income, comes not from agriculture or indsustry but services. Yet this one sector, where we got closest to China and the US in productivity growth, but it receives no subsidies from Govt. On the other hand, through a variety of devices like MAT, this sector is unfairly overtaxed while manufacturing is subsidized. Clearly we need to rethink our policies in light of our competitive strengths.
A look at the numbers. Services output per worker grew from $2854 in 1990 to $9810 per worker in 2019; that is 3.44X times, the best gain in productivity compared to Agriculture and manufacturing. A sector that is forced to feed the inefficient industry!
In China, services value added per worker grew from $3180 in 1990 to $15558 in 2019, or 4.89X times. Note its only in services that we came anywhere near China’s productivity gains although we were still beaten.
In the US, services value added per worker grew from $70,000 to $109433, or 1.56X times. Note, this the only sector India’s gains in productivity convincingly beat those in the US 3.44X to 1.56X. But in absolute numbers we have a long way to go.
Who has failed India? The tycoons. The old moneyed tycoons who own politicians, thrive on Govt. rents, and build monopolies at the expense of consumers have failed us, although they were the biggest beneficiary of the reforms process.
I won’t go into details, but duty inversions caused by faulty exchange rate setting by RBI, that not only crippled manufacturing exports, but also wiped out domestic industry, is largely to blame, for which RBI must bear full responsibility with its faulty models.
Anecdotal evidence will give some idea of the colossal failure here. The Japanese, finding assembling of TV sets in Japan expensive, moved their assembly plants to China. In time China became the world’s largest exporter of TV sets nevermind what brands. In India, with reforms, the TV manufacturers should have followed a similar cycle to those in China. We had a better component manufacturing base prior to 1990. However, leave alone exporting TV sets, our domestic manufacturers got wiped out and landed the banks with some 20,000 crores of bad debts. That’s the havoc wrought by RBI’s faulty models and the pusillanimity of our reformers.
As I noted earlier, with his return to protectionism, Modi is only making things worse, while RBI continues with its faulty exchange rate management models.
How did the poor do under
Reforms:
Have the lower income groups benefited from growth?
For this we look at the poverty numbers and the growth in come of the lowest 20% of the population over the last 30 years. The data is revealing.
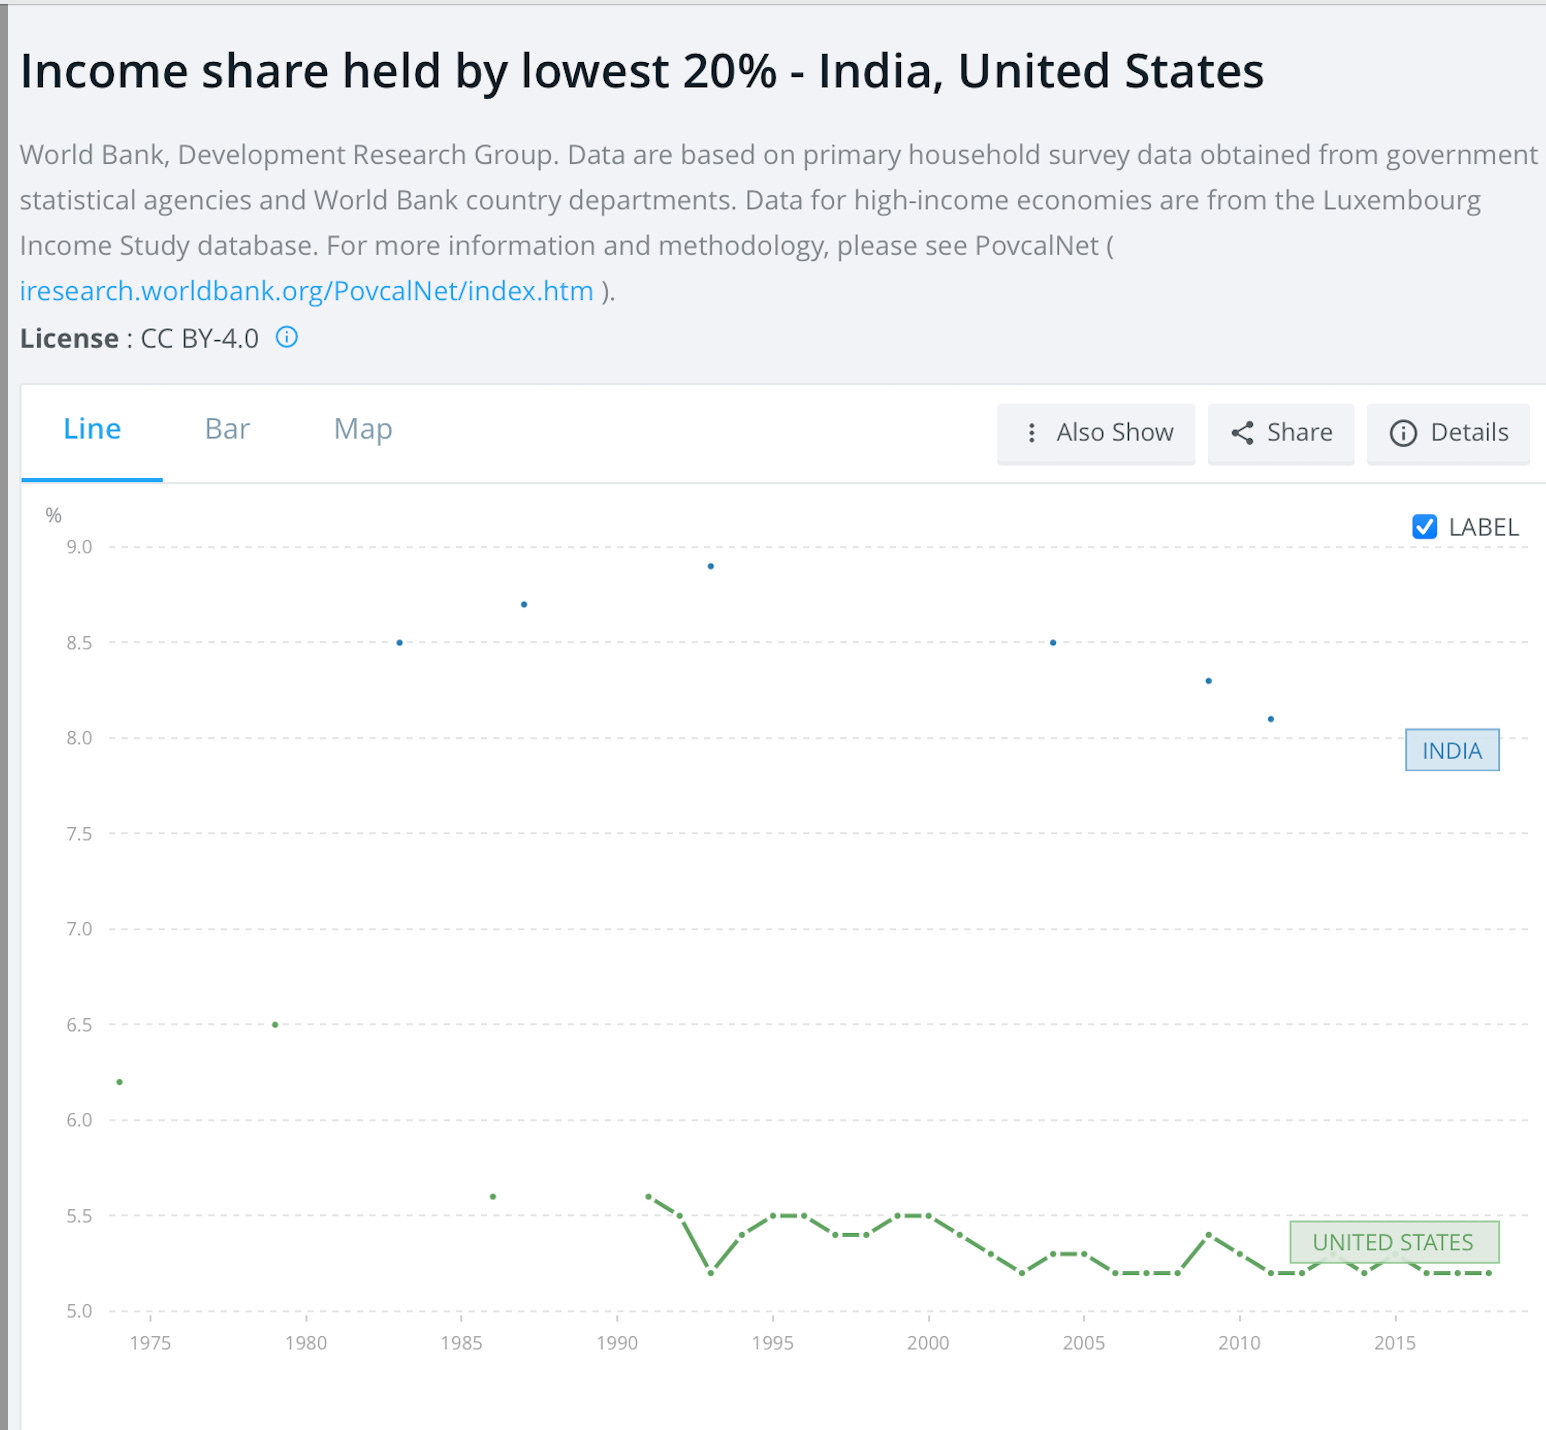
In 1990, the share in national income of the bottom 20% of the population in India stood at 9% of GDP. This declined to 8% of GDP in 2018/19.

However, despite the deciline in share of national income by 1 percentage point from 1990 to 2018/19, the number of poor, defined as those earning less than $1.90 per day [2011 PPP prices], declined from around 12% of the population to about 4%.
Which is to say, by stepping up the GDP growth rate from 3.5% per annum to 7% per annum, India was able to shrink its poverty by two-thirds over 30 years, despite the fact that the share in income of the bottom 20% of the population slid by 1 percentage point. The growth in GDP more than offset the shrinkage in share.
The effect of growth on poverty is revealing. Note the above data segments the population into 5 income groups of 20% each by income. Each of the lower 4 income groups lost roughly 1 percentage point in the share of total income. All of the losses went to the top most 20% who increased their share from 42% in 1990 to 45% in 2019.
In China, the highest 20% income group held 46% of the national income while the percentage in the US was 47%. Remarkable isn’t it? Socialism, Capitalism, reforms, no reforms, the income shares remain remarkably resilient.
However, growth is the tide that lifts all boats. So here is the simple lessen for ideologues of the Marxist kind. If you really want to help the poor, go for growth; not distribution, because human ingenuity will see the well off preserve their share. If at all you must have some distribution, it is only justified in terms of efficacy to the lowest 10% where people are often stuck in Malthusian poverty traps, that can only be broken open by minimum wages or some kind of guaranteed income. The rest of ideology - left, right, center - is simply hot air.

Government Finances:
The whole idea of the reforms package was to cut non-merit subsidies, lower taxes, boost compliance, and eliminate the fiscal deficit to the barest minimum to offset any cyclical contractions. Where do we stand?
Here is the chart of Tax revenues to Govt. as a percentage of GDP from 1990 to 2020.
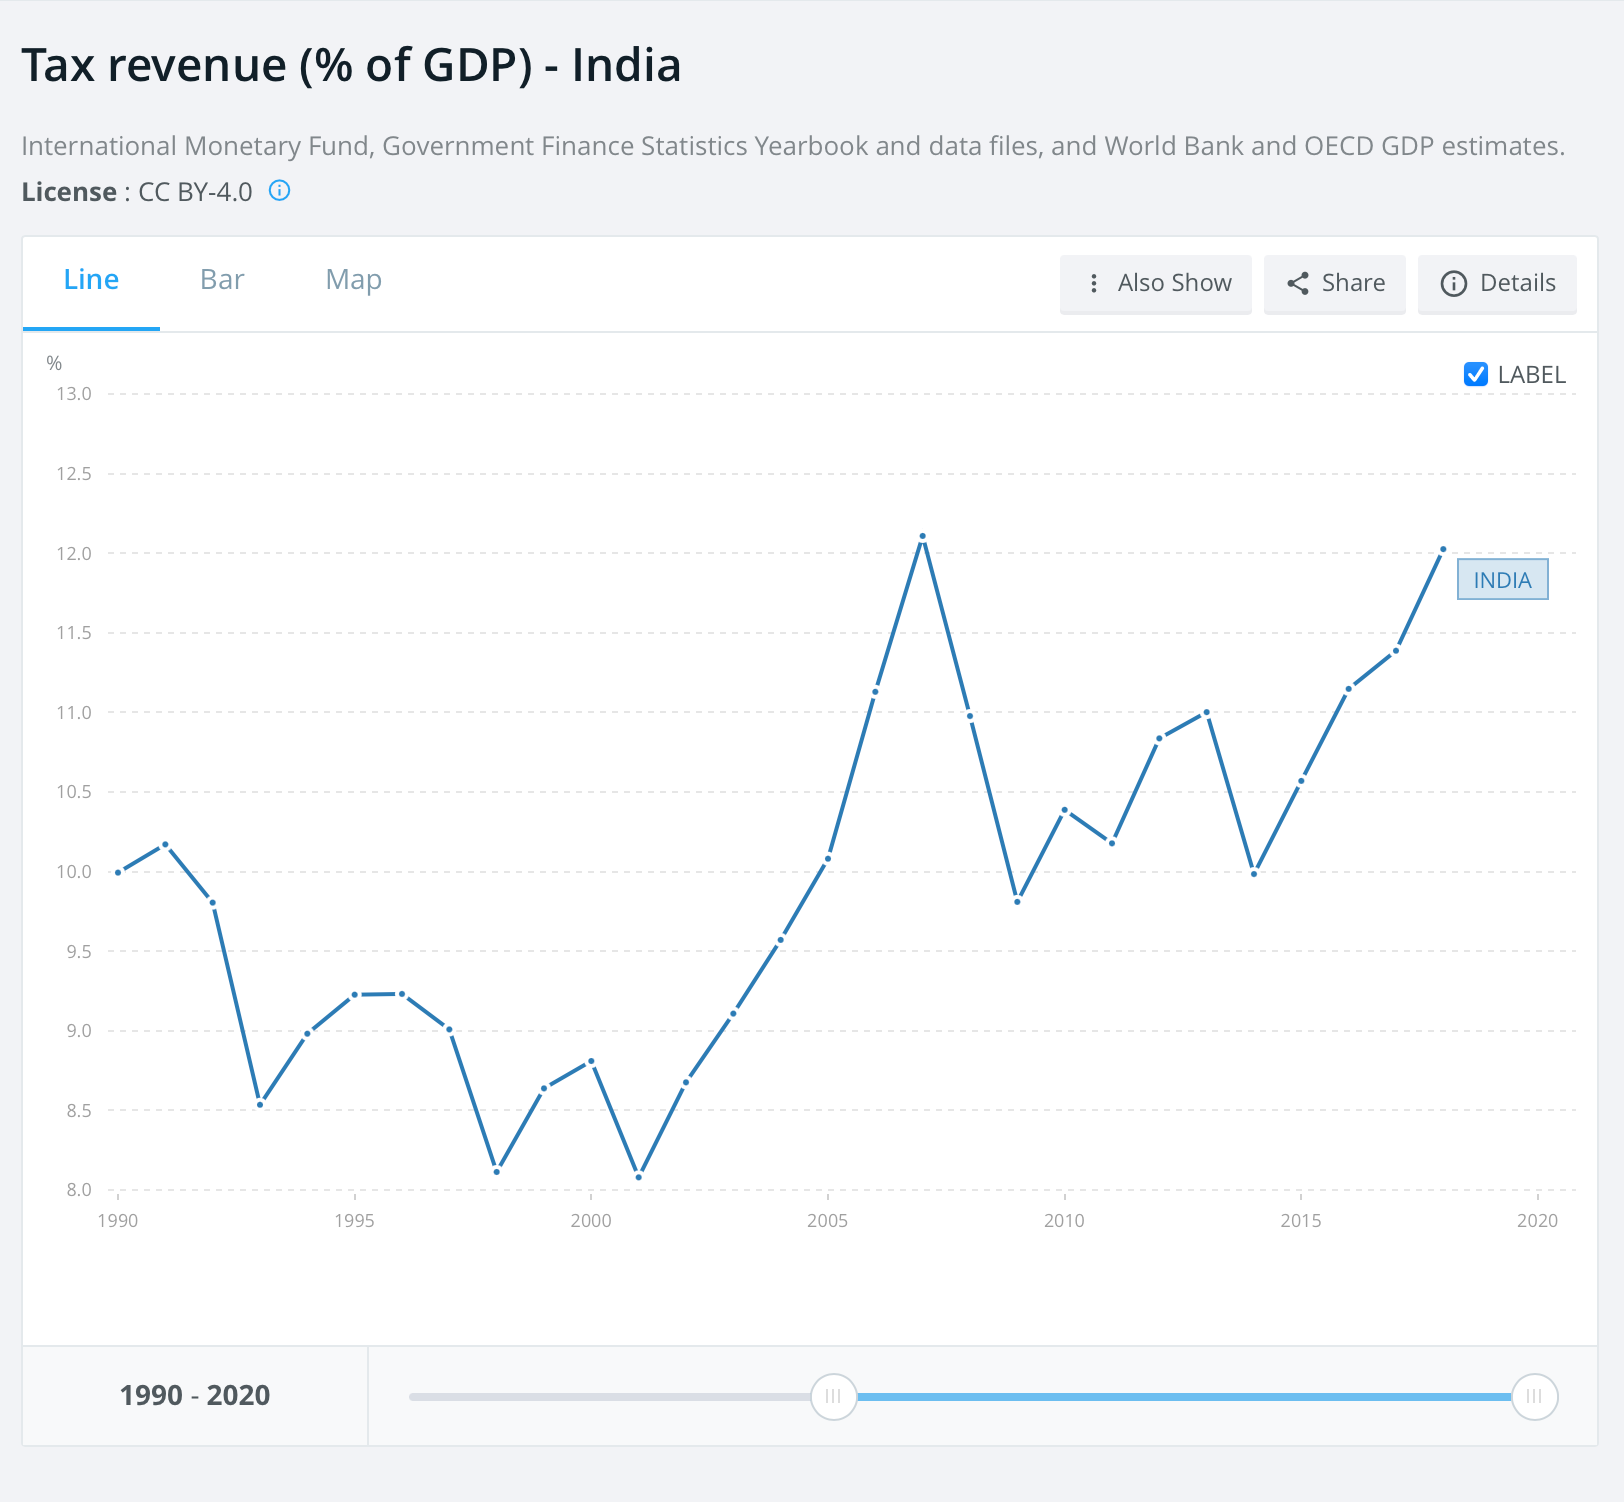
We started with tax revenues of the Central Govt. at 10% of GDP in 1990, lowered the ration to 8% in 1998, when ABV got off our nukes. The following sanctions, reduced trade, and output, send the tax to GDP ratio shooting to 12% of by 2005. This effective broke the momentum of the economic reforms from which we never really recovered even under UPA-I. But such is the perversity of our discourse that this tragedy is never discussed.
Reforms suffered the utmost under Vajpayee and his “Lekin yeh sab hoga kaise” utter disbelief of reforms. Of course my favorite editor mentioned this approvingly even as he gushed about reforms. From privatization of oil majors, to roll back of agricultural subsidies, Vajpayee put everything on hold.
The nuke tests, and the euphoria around them, scuttled any talk of reforms as people rallied to the flag to defend them never-mind the cost to the economy. Those were also the years when US manufacturing went lock, stock & barrel to China, who had devalued its currency by a factor of 6X while we were clinging on to a 3X level against the Dollar, in a show nationalistic pride in the nukes.
Mind I have nothing against the nukes. But we need to reckon the what they actually cost us.
That aside, what is notable about tax to GDP ratio is that it is back 12% of the GDP, the highest level ever before or after reforms. It doesn’t matter what Modi claims. The numbers speak for themselves. The second thing to note is that the tax to GDP ratio for China is 9.5% of GDP while that for the US is 10.5%.
Much is made in Govt finances of things like Capital receipts, disinvestment etc. These numbers are relevant to accounting but not to the economy as such. That is because, Govt really gets only tax revenue from the GDP. Everything else that it spends comes from the Gross Domestic savings pool, whether it is borrowing through debt or sale proceeds received from stocks purchased by investors. In a purely economic sense, disinvestment carries no interest cost but is a one time receipt. But if you are looking to Govt. finances as a whole, the disinvestment, while welcome, also has to come from savings, and to this extent, diminishes future investments in the economy..
Govt. Final Consumption:
If the Govt takes in between 10 to 12% of GDP as tax revenues, what does it spend? Its total spending measured by Govt. Final Consumption, which includes everything from salaries, to subsidies, defence, etc. Only spending that goes to Gross Capital formation, is excluded. Here is the chart:
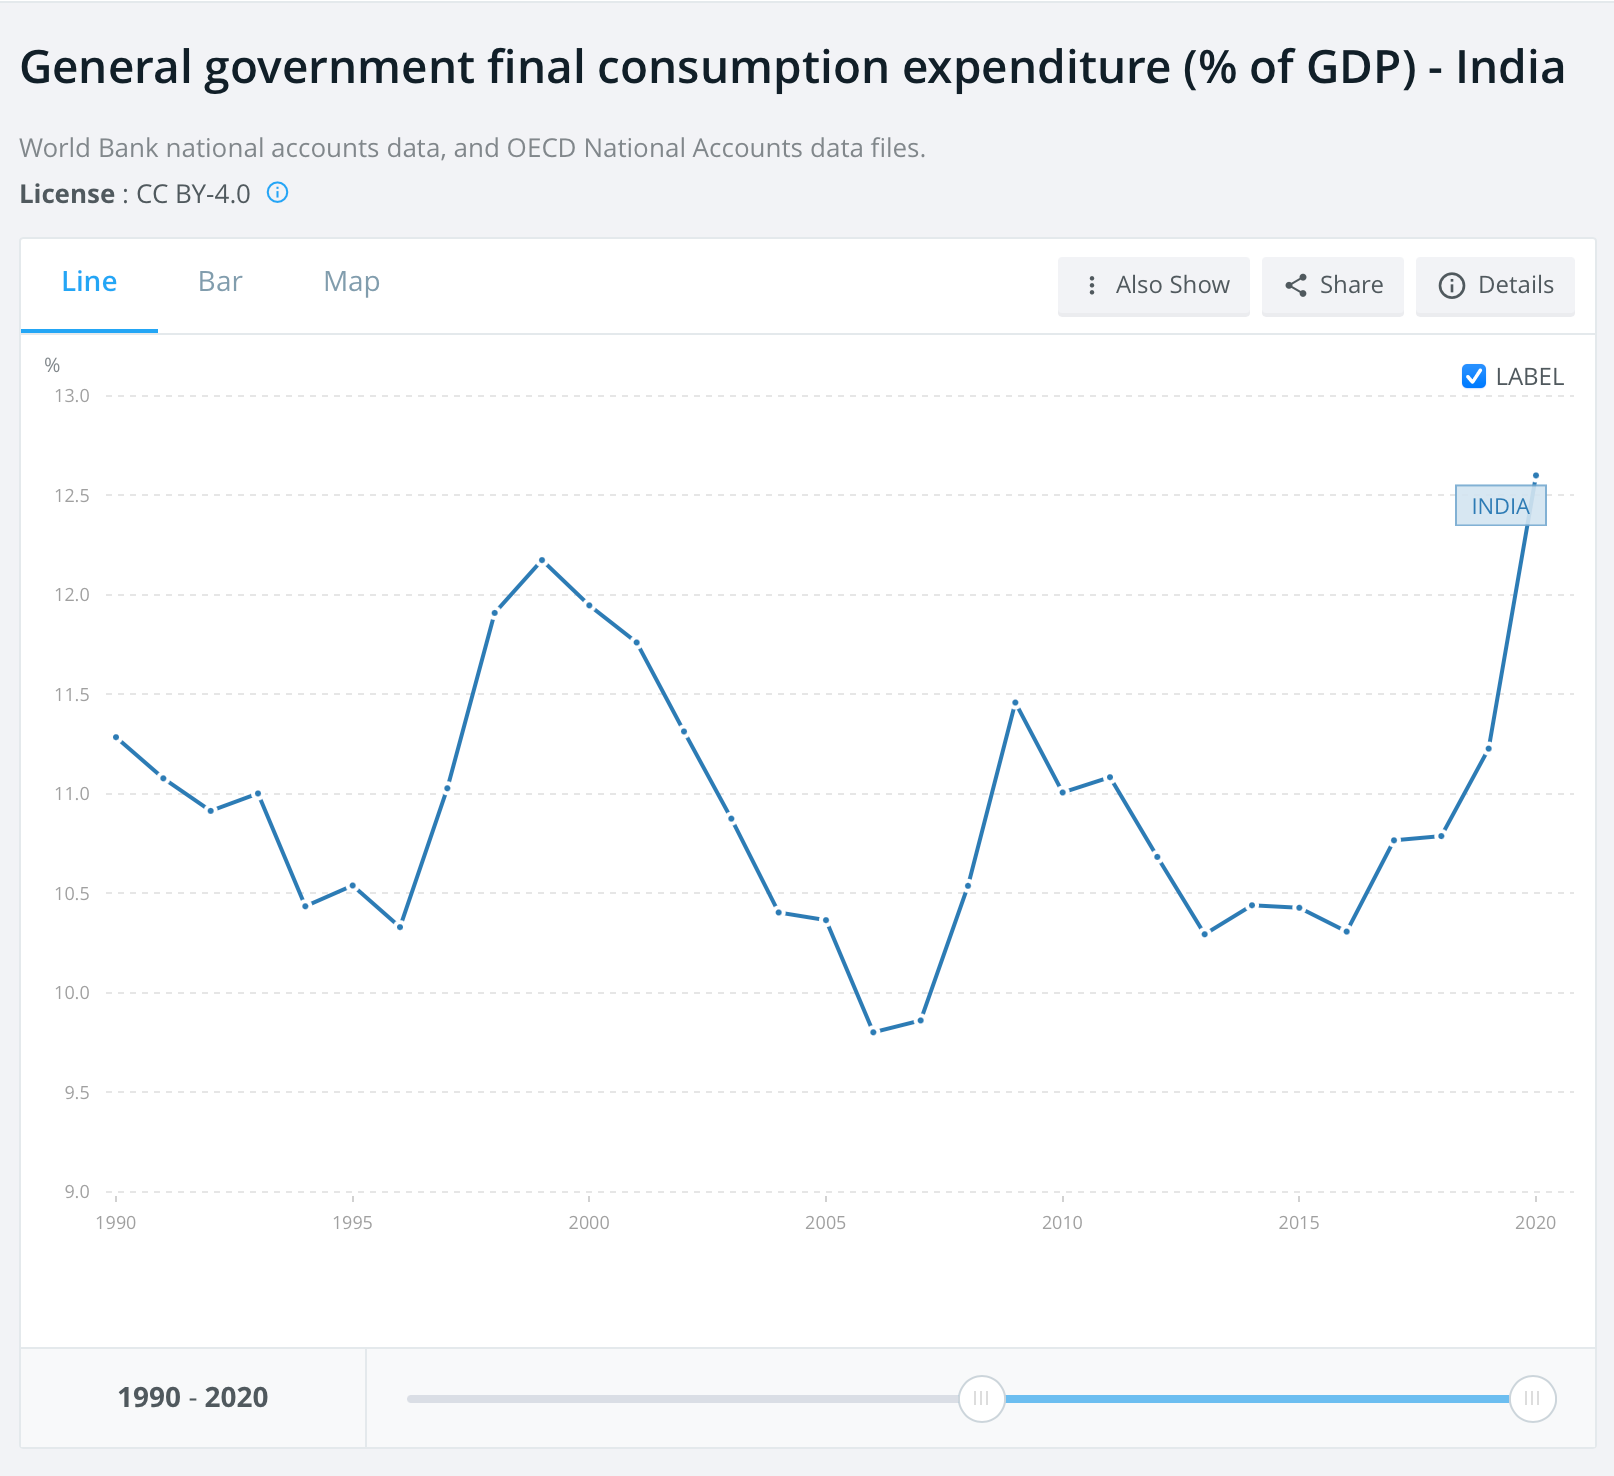
As you can see, GFCE is usually between 10.5% of GDP and 12.5% of GDP. Give a percentage point here and there, GFCE closely tracks Tax revenue to the Govt. The difference of 1% between the two represents the primary deficit; which is essentially Govt expenditure not met by tax revenue but borrowing.
You can see the Vajpayee effect between 1999 to 2005 on the charts. That’s when Vajpayee slashed Govt expenditure to try and contain the revenue shortfalls that I pointed earlier, following the nuke tests. Such slashing of Govt expenditure was bound to affect GDP growth, which it did. Not surprisingly, Vajpayee lost the election in 2004.
We are back to historic highs of 12.5 in GFCE under Modi. This number will likely be overshot by at least 2 percentage points this year. Hence the need to tax anything that moves by the Modi regime.
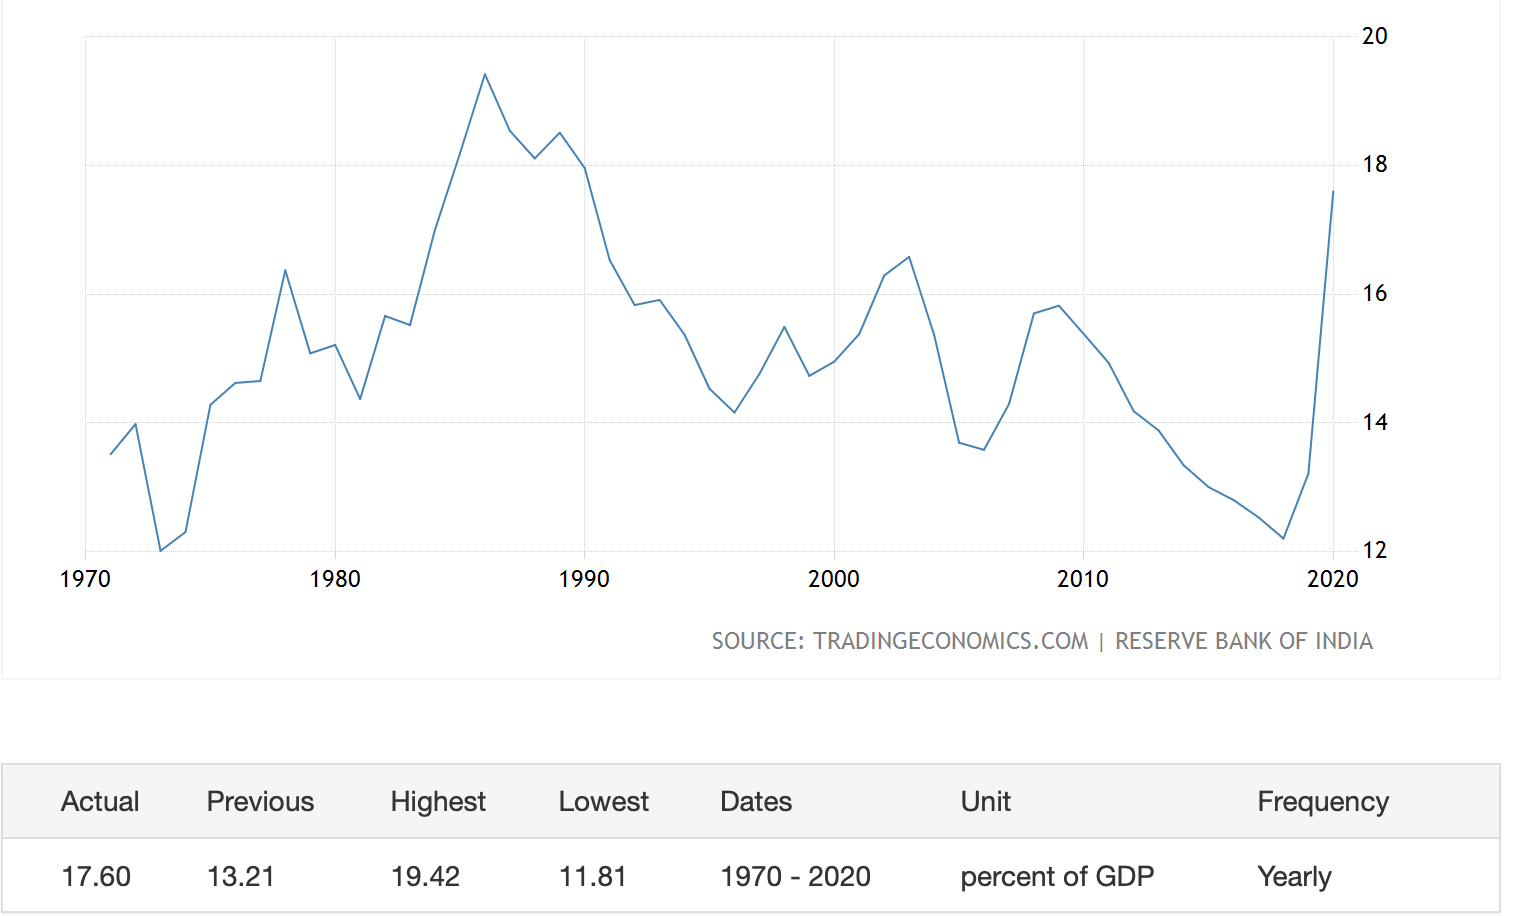
In contrast to GFCE, total Govt expenditure includes spending on such as infrastructure that go to add to Gross Capital Formation.
In 1990, this figure was close to 18% of GDP. But for the Vajpayee nuke effect in 1998-2004, the number has been dropping continuously from 18% of GDP to 12% of GDP in 2019. There was a small hiccup caused by the financial crisis in 2008 that was quickly worked out of the system.
However, despite all of Modi’s efforts, who brought the ratio down from 14% in 2014 to 12% in 2019, [with some massive window dressing of course], we are back to 18%.
Fiscal deficit as
percentage of GDP:
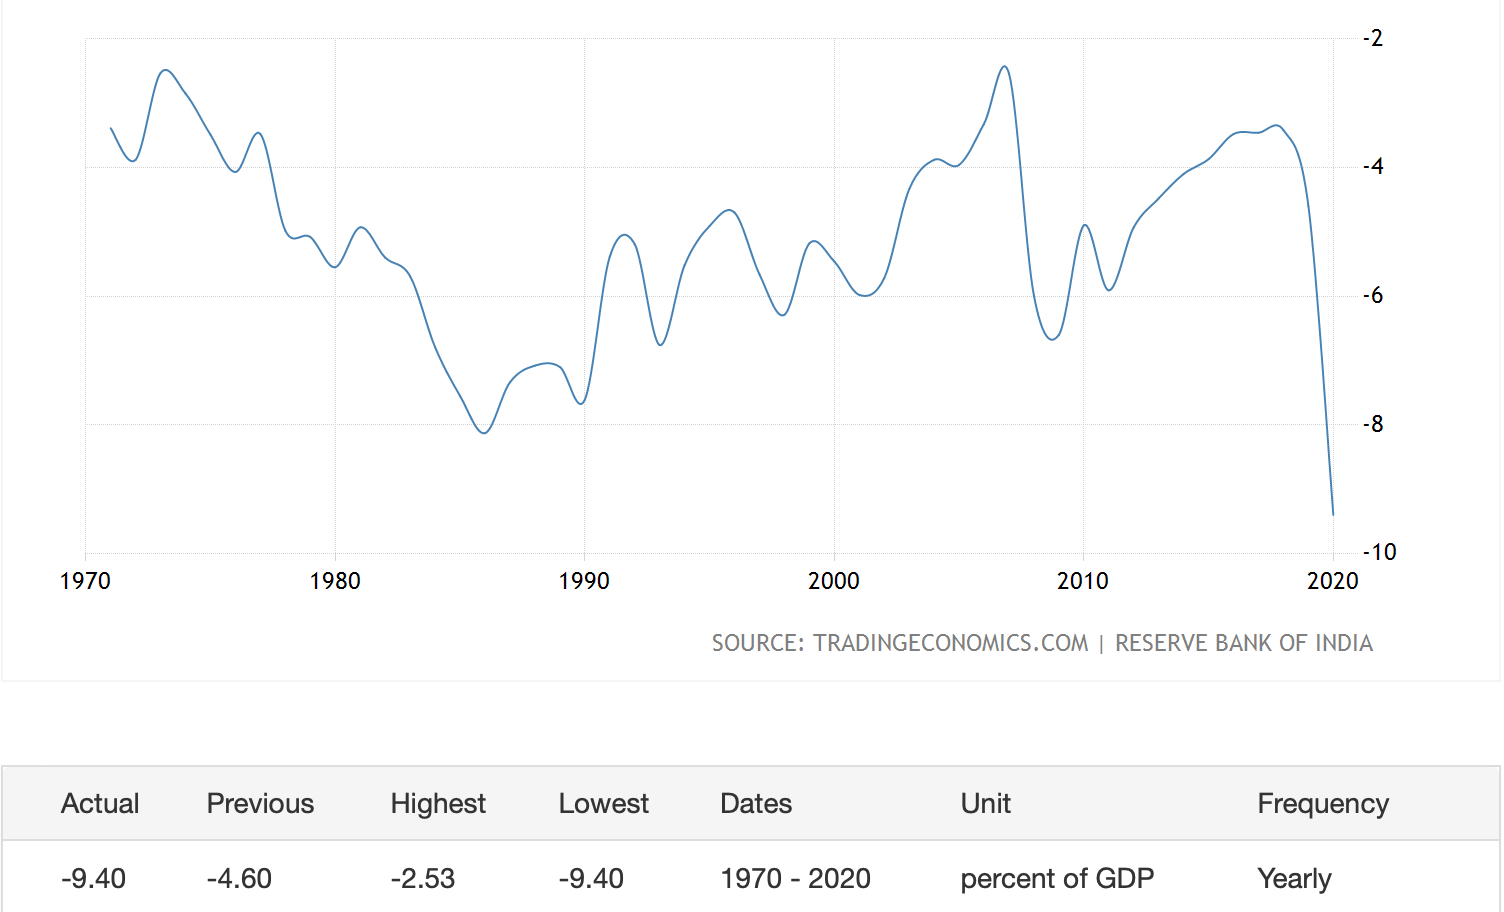
Reforms began with fiscal deficit of 7% of GDP, and gradually improved to 2% of GDP 2007. Then came the financial crisis of 2008, and the deficit widened 6% of GDP. It gradually recovered to 3.5% of GDP in 2019 before sinking back to 9.5% of GDP in 2020.
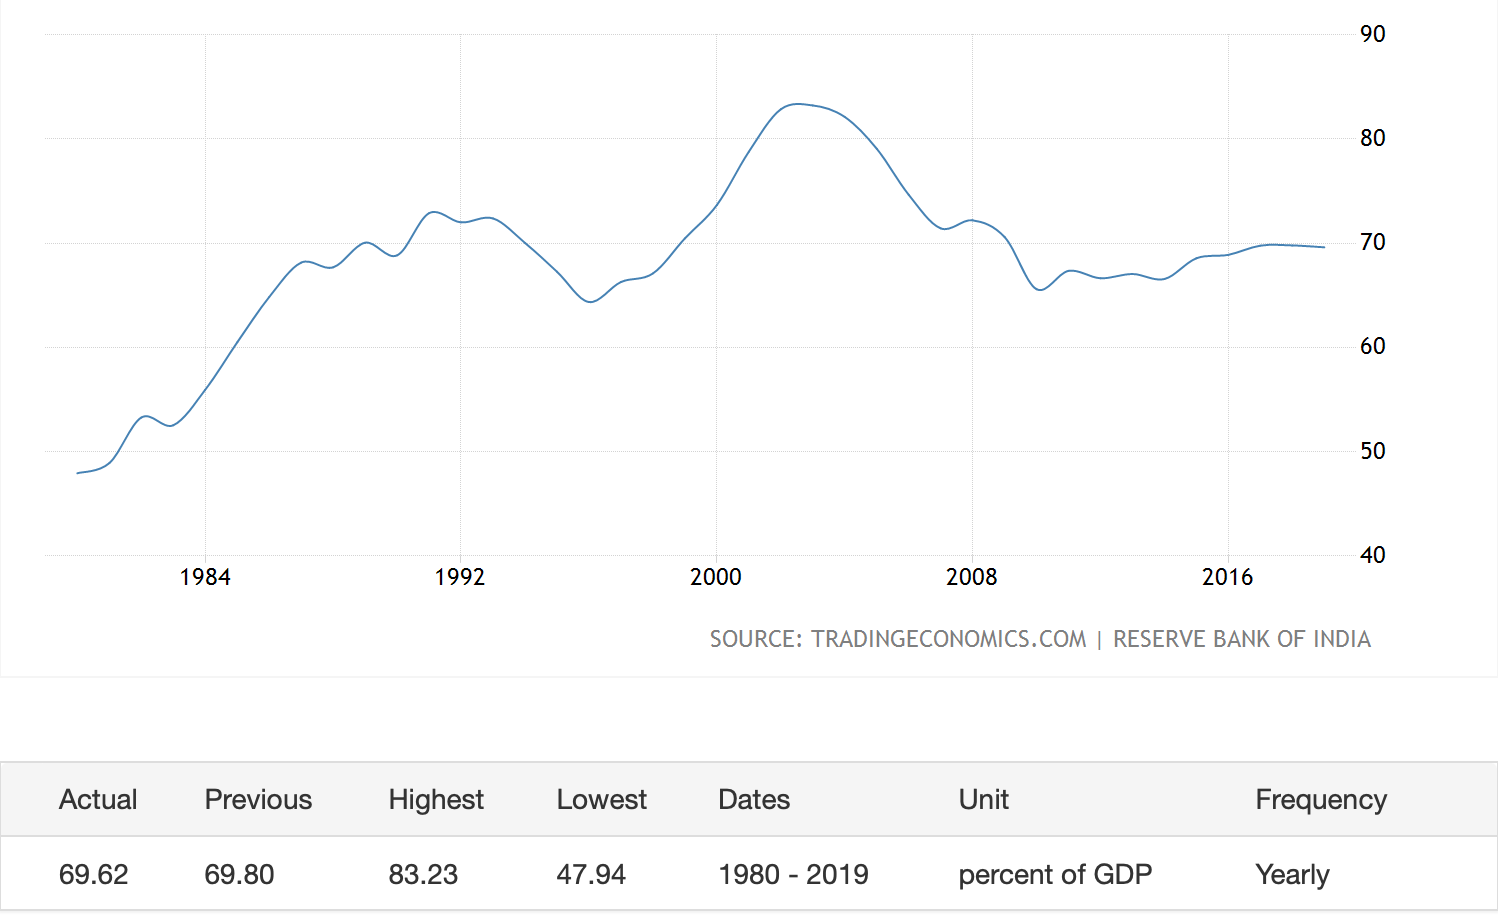
Govt debt peaked 2003-04 after the fallout of the nuke tests at 82% of GDP having begun the reform journey at 72% of GDP. It finished 2019 at 70% of GDP and is now back to 90% of GDP.
How have Govt. finances improved under reforms? I leave it to you to judge. The numbers are dismal.
I am from non finance background. I find your writings interesting and insightful. Thanks!
Further reforms are needed in sectors which are still protected. For example, liquor production, distribution and selling. Another is electricity, transparency in accounting of state electricity board will show that many Power Purchase agreements are made with coal power plants that make state pay high cost when plant is not used. Cost must paid to keep base load power available, but what is being paid is very high.