

Three curious features of the Budget Numbers
Is the GDP deflator for 2021-22 understated thus over-estimating GDP for the year?

Draining the Small Savings pool:
There 3 very disturbing features of the budget that merit deep thought.
First borrowings from Small Savings have become an integral part of the budget, as the following statement shows:

2019-2020 2020-2021
1.
7.
8.
1.
7.
8.
Debt Receipts (Net)
2.
3.
4.
5.
(3i'iä7?T
2.
3.
4.
5.
6.
Market Borrowings
(G-sec +T Bills)
Securities against Small
Savings
State Provident Funds
Other Receipts (Internal
Debts and Public Account)
External Debt
Draw Down of Cash Balance
Grand Total
Actuals
624089
240000
11635
44273
8682
4971
933651
Budget
Estimates
535870
240000
18000
50848
4622
(-)53003
796337
2020-2021
Revised
Estimates
1273788
480574
18000
39129
54522
(-)17358
1848655
2021-2022
Budget
Estimates
967708
391927
20000
54280
1514
71383
1506812")
In 2020-21, the Govt. borrowed INR 4.81 Trillion from Small Savings, compared to INR 12.38 Trillion from the market. In short Govt. took almost 26% of its borrowings on the capital account from small savings. The legal fiction that small savings are not Govt. borrowings has vanished. Worse, next year Govt. proposes to borrow another INR 3.92 trillion from the small savings corpus. That’s almost 26% of its PSBR for next year.
Interest Payments as percentage of Revenue:

The Govt. tax revenue is about 8% of NGDP. [Nominal GDP]. Up until 2019-20, on top of the revenue, Govt. was borrowing about 5% of NGDP from the market, to spend about 13% of NGDP on itself and its various programs.
In 2021-22, Govt. tax revenues were still 8.07% of NGDP, less than that at 8.30% in 2019-20. So all this euphoric talk of unprecedented tax buoyancy is bogus. Tax revenues have in fact declined from the 2019-20 base.
What has gone up is all kinds of borrowing. Govt. has emptied every little piggy bank of which it is a custodian, to raise its market borrowings from 4.94% of NGDP, to 7.65% of GDP. In effect, it borrowed INR 6.93 trillion incrementally over 2019-20, which is about 2.65% of NGDP. These borrowings were largely from Govt. controlled piggy banks, like Small Saving corpus, and not from the market where borrowings were limited to about INR 12 Trillion, keeping market interest rates capped below 7%.
Even so, interest payments on borrowings have now gone up INR 6.12 trillion to 8.10 trillion; that is 3% of NGDP to about 3.66% of NGDP.
Interest payments now eat up 45% of all tax revenues, up from 36%. The prospects of the situation improving in the near future are very dim. Half our taxes go just to pay interest on Govt. debt. Think about it.
The curious gyrations in the GDP Deflator:
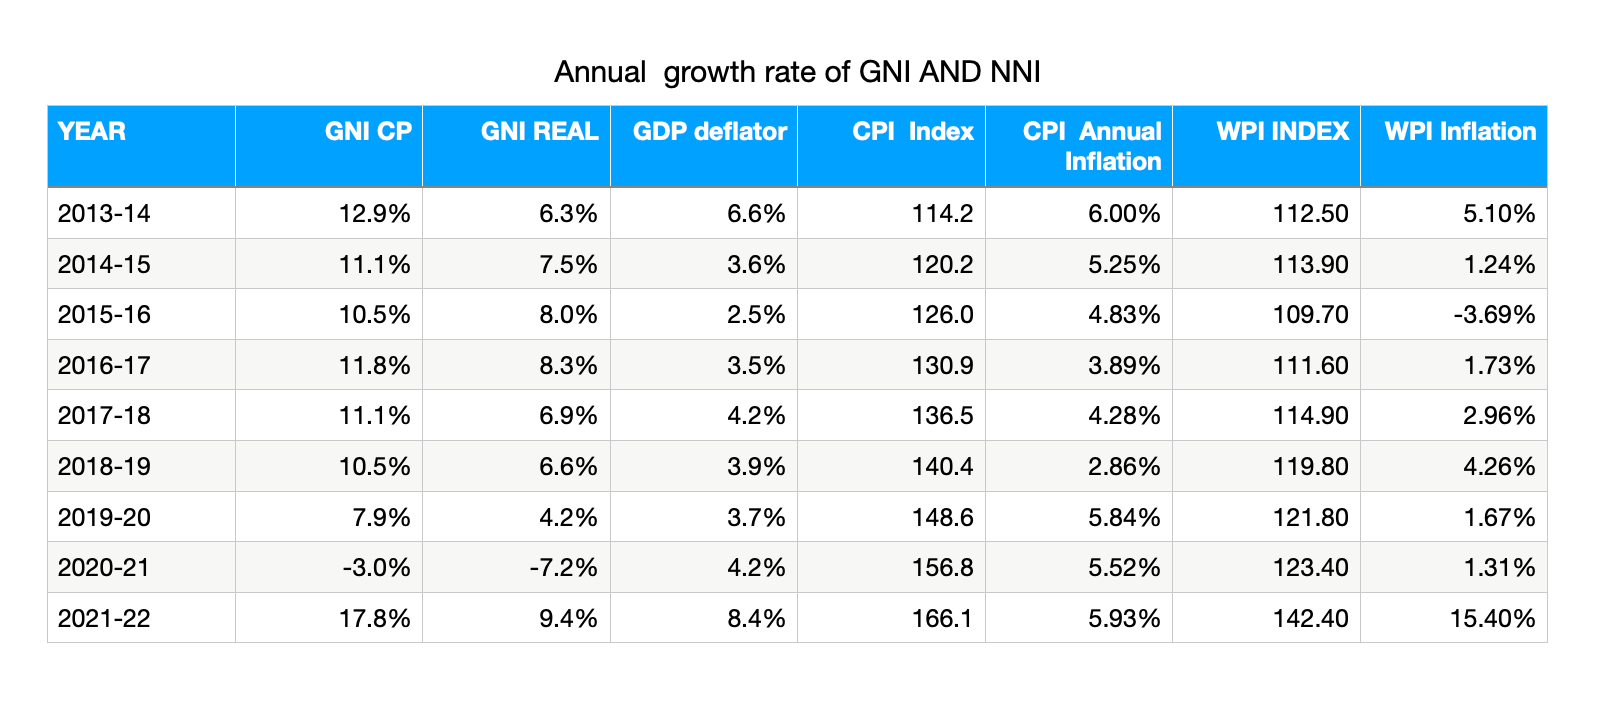
The table gives you annual growth rate of Nominal GNI, Real GNI, the implied GDP deflator, and the annual CPI and WPI inflation since 2013-14.

The thick maroon line is the GDP deflator, compared with the annual inflation rate calculated by monthly average CPI Index numbers. Retail inflation has general been MORE than the GDP delator since 2013-14. Only once in 2018-19 it dipped marginally below the GDP deflator for the year.
In 2021-22, the GDP deflator is 1.4x times the annual retail inflation. Why this curious reversal all of a sudden?
The situation becomes more cruiser when compare the WPI inflation with the GDP deflator as below.

Again, the thick maroon line is the GDP deflator, and the blue line is the combined WPI inflation.
In the past the GDP deflator has usually been marginally above WPI inflation or equal. In 2021-22, the WPI inflation has shot through the GDP deflator to print at 183% of the GDP deflator.
In short the GDP deflator is seriously out of whack with both retail inflation and the WPI Inflation. Indeed the GDP which never exceeded 4% pa is now 8.4% when retail inflation is only 5.9%. The numbers don’t compute.
My feeling is the that the GDP deflator is way above 8.4% and has been massaged to a lower level of 8.4% in order to overstate GDP and present a rosier picture of recovery.
Would be happy to be proved wrong.
Sonali 01.0. 2022.
Waiting too long to come back to twitter. Please do so, Miss you a lot
I just hope you are okay. Miss you/ your work.